Toronto drivers lost about 100 hours to rush-hour traffic in 2025, report finds
TomTom’s Traffic Index shows Toronto motorists spent roughly 100 hours stuck in rush-hour congestion in 2025, making the city the second-most congested in Canada.
Copy link
By Torontoer Staff
Toronto motorists spent about 100 hours stuck in rush-hour traffic in 2025, according to TomTom’s annual Traffic Index. The figure is nearly four hours higher than in 2024 and leaves the city second only to Vancouver in nationwide congestion rankings.
TomTom’s analysis shows average congestion in Toronto was 47.7 per cent for the year, a slight decline from 2024, even as travel times increased and speeds fell on many routes.
The headline numbers
- Estimated hours lost to rush-hour congestion in 2025: about 100 hours, roughly four days.
- Canada ranking: second-most congested city, after Vancouver (112 hours).
- Average congestion level: 47.7 per cent.
- Average rush-hour speed: 18.9 kilometres per hour.
- Average 10-kilometre drive: 26 minutes, 40 seconds.
How congestion looked on the road
On local roads a 10-kilometre trip averaged 26 minutes and 40 seconds across the year. Morning rush-hour drives averaged 29 minutes and eight seconds for the same distance, while evening trips stretched to 34 minutes and five seconds. Highway travel remained faster, with an average speed of 53.6 kilometres per hour, about half of many posted limits.
TomTom’s report notes that average rush-hour speeds of under 19 kilometres per hour on city streets translate into longer commutes and less predictable travel times for people who drive regularly.
When congestion peaked
The worst day for Toronto traffic in 2025 was Valentine’s Day, February 14. Average congestion that day reached 76 per cent, and a spike at about 6 p.m. hit 106 per cent, with drivers averaging only 3.8 kilometres in 15 minutes.
Those peak figures reflect short periods of extreme slowdowns on top of generally elevated congestion throughout the year.
Where the data comes from
TomTom’s Traffic Index is based on anonymized trip data collected from drivers in metropolitan and central city areas, including arterial streets and highway crossings. The company says the dataset covers more than 3.65 trillion kilometres globally, allowing comparisons across cities and years.
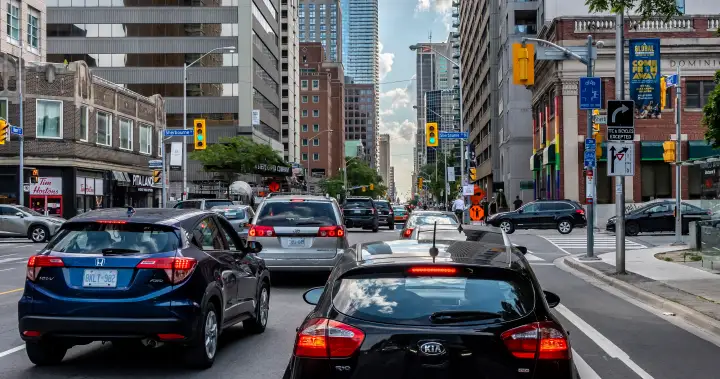
Drivers in Toronto lost roughly 100 hours to rush-hour congestion in 2025, reflecting both persistent peak-period pressure and slower travel speeds on many corridors.
TomTom Traffic Index
What this means for Toronto
Higher travel times have implications beyond commuter frustration. Slower speeds increase fuel consumption and unpredictability for deliveries and services that depend on road reliability. The contrast between local street speeds and highway speeds points to capacity and flow problems on urban arterials.
City planners and transportation officials monitor these trends when prioritizing road works, transit improvements and congestion-management strategies. For drivers, the practical effects are longer trips, more time spent travelling and narrower windows for time-sensitive trips.
What to watch next
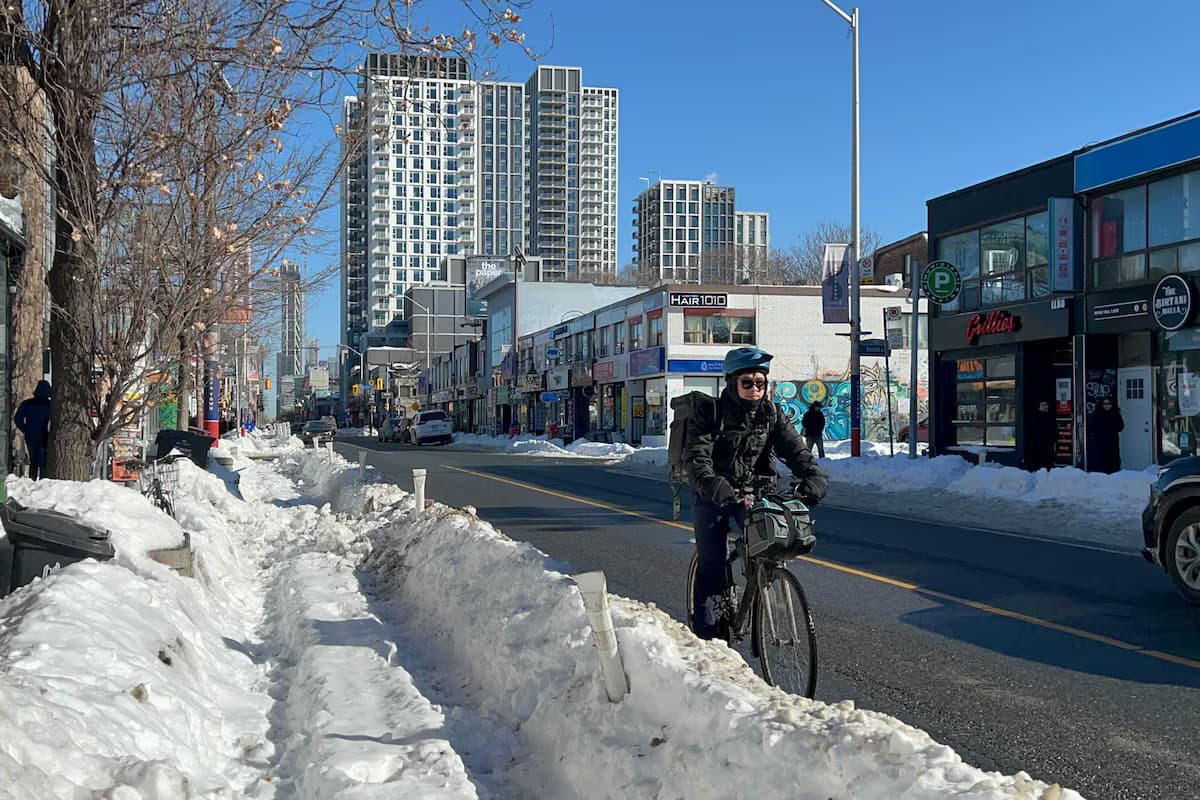
TomTom’s 2026 update will show whether modest improvements in the average congestion level translate into shorter journeys. Officials and commuters will also be watching how investments in transit, cycling infrastructure and traffic management influence speeds and reliability on key corridors.
The Traffic Index provides a standardized way to track those changes, but local policy decisions and commuter behaviour will determine whether Toronto moves down the congestion ranking in future reports.
TomTom’s 2025 Traffic Index underscores that congestion remains a persistent issue for Toronto, affecting daily travel times and the broader efficiency of the city’s road network.
trafficcommuteTomTomtransportationToronto